Property Marketplace Analytics Dashboard
Product, inventory, and cost analytics for the team running the assistant
The Problem
Once the assistant was live, the team was flying blind on three fronts.
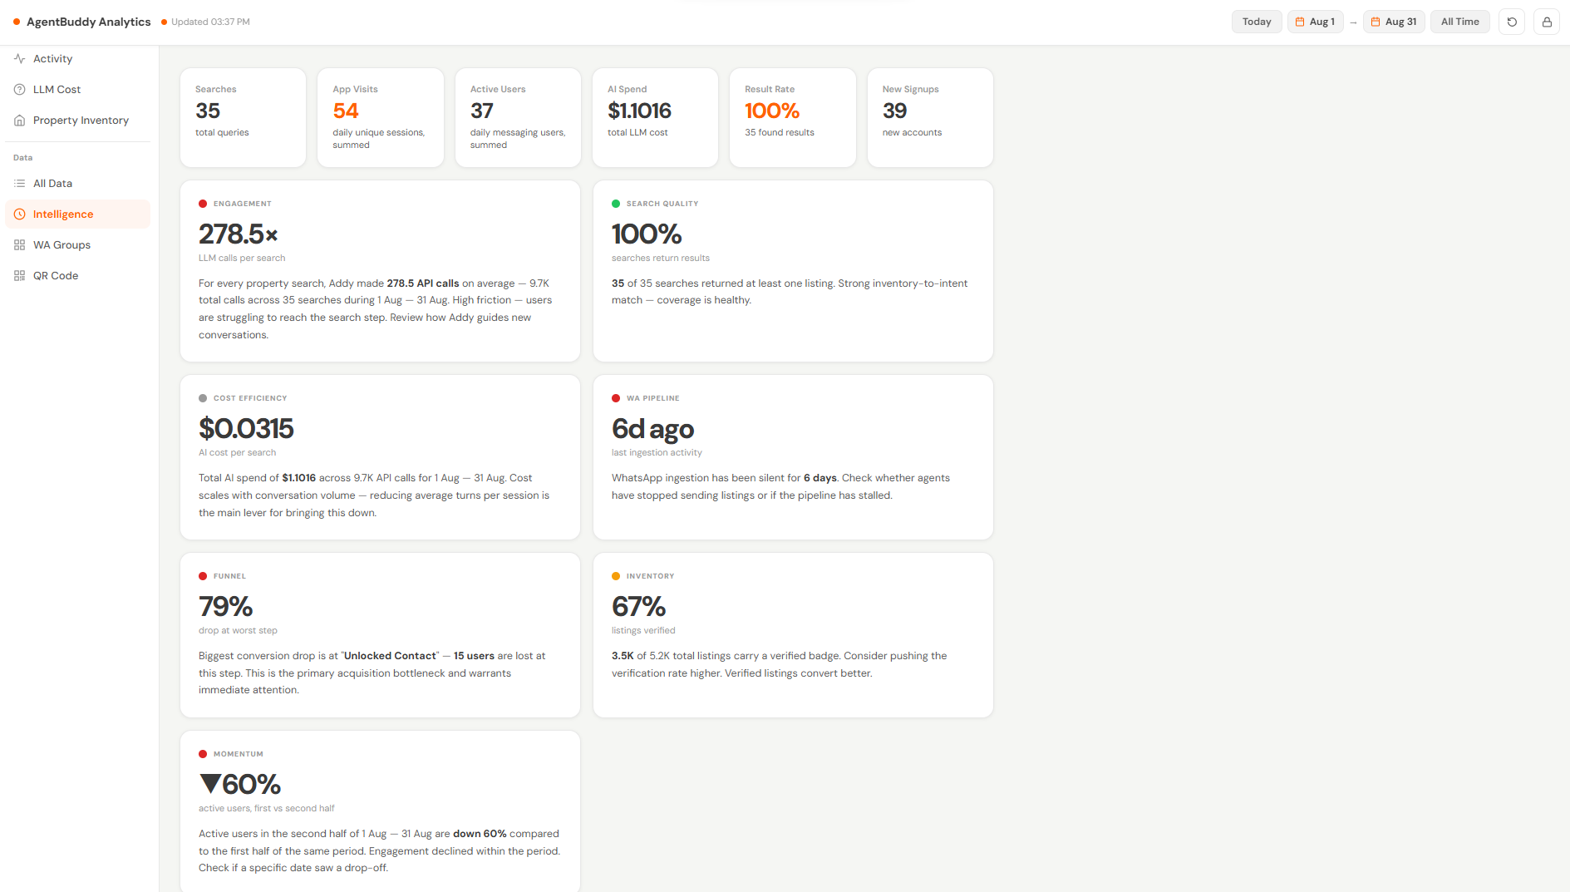
There was no product analytics — no way to see how people were actually using the app, where they dropped off, or whether search was even returning results, so every product decision was a guess rather than a measurement.
There was no visibility into the property inventory itself: which sources were still feeding in fresh listings and which had gone quiet, so a source could stop producing for weeks before anyone noticed.
And there was no cost accountability — the assistant's chat and the separate ingestion pipeline both make LLM calls, but nothing broke down what each was actually costing to run.
This wasn't a dashboard problem. It was a visibility problem: the team couldn't act on data they had never seen.
The Approach
The dashboard is built around three questions the team actually needed answered, each backed by its own SQL views over the production database.
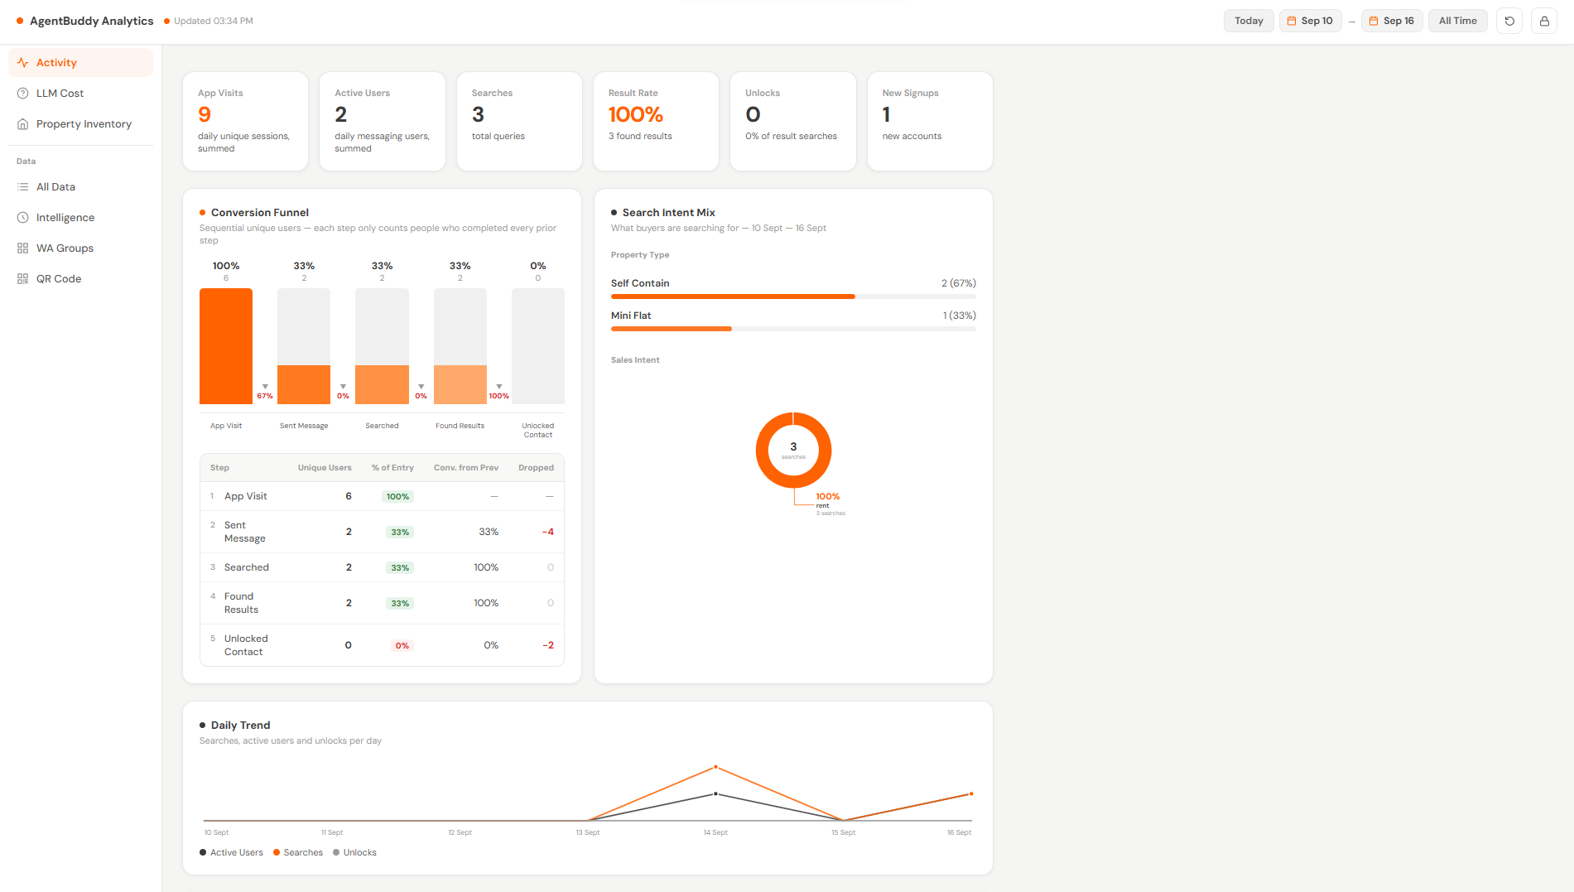
Product analytics tracks the same funnel a growth team would care about for any consumer app — visits, first message sent, search, searches that actually returned results, and contact unlocks — broken down daily and, for the current day, hour by hour. The funnel is computed per-user as well as in aggregate, so drop-off between any two stages is measurable, not just guessed at.
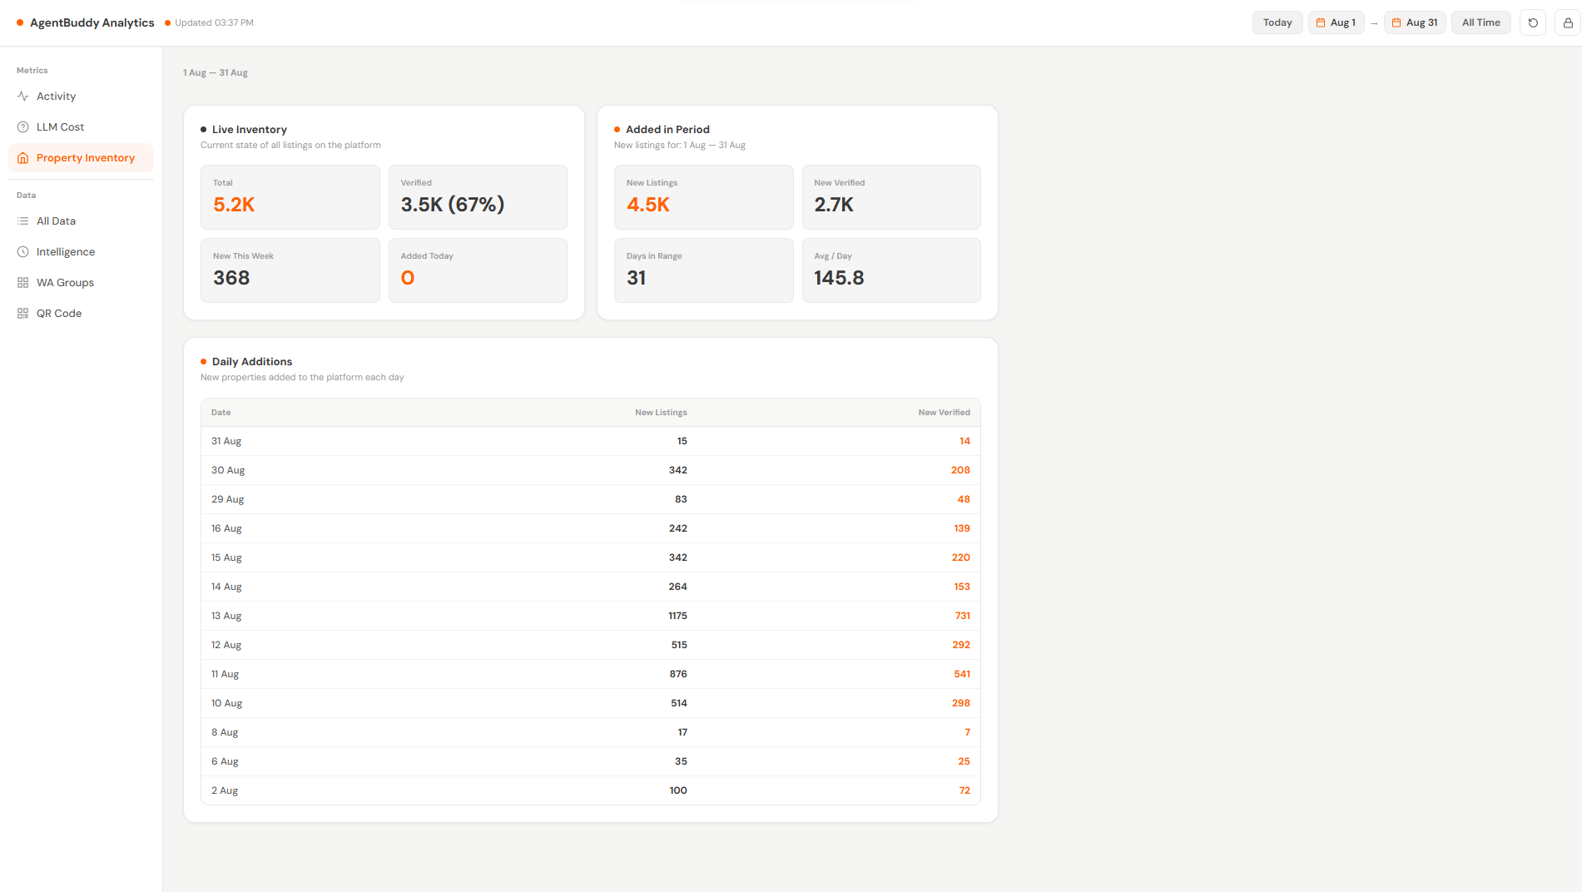
Inventory and ingestion health surfaces live counts of active, verified, and unverified listings alongside new-listings trends by day. Since most listings arrive from informal sources with no other visibility into them, each informal source gets its own rolling counts across 3 hours, 24 hours, 7 days, and 30 days — so a source that's gone quiet shows up immediately instead of silently draining the inventory over weeks. A source going quiet produces the same signal as a source with nothing new to report — silence looks identical either way unless you're explicitly watching for it.
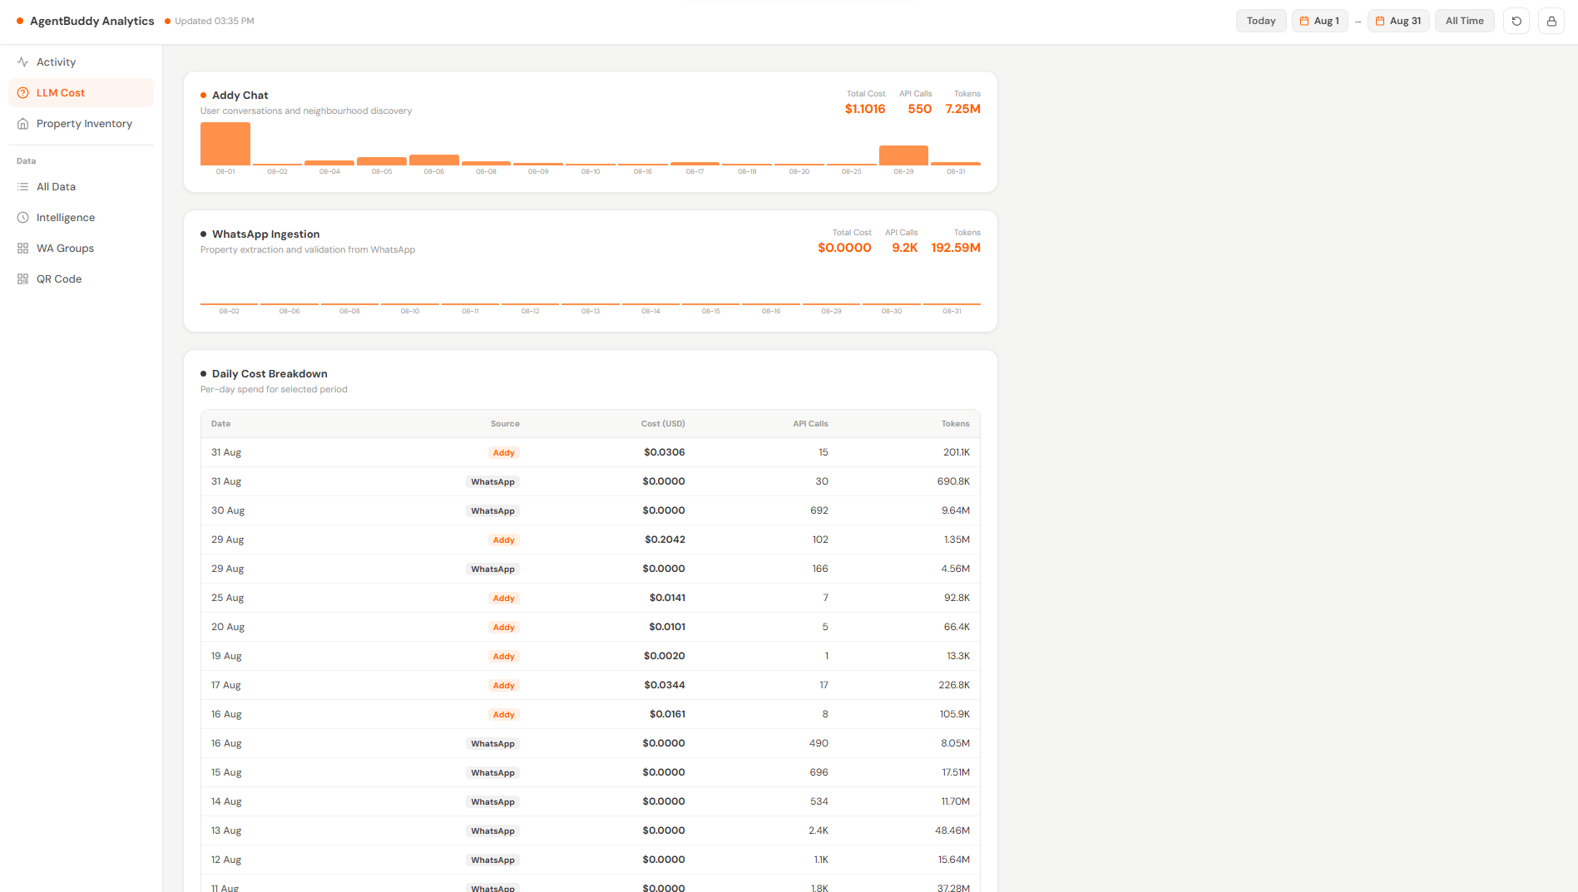
Cost tracking splits every LLM call by where it came from — the assistant's own conversational search versus the ingestion pipeline's extraction and classification calls — with cost, token counts, and call volume available daily and hourly. That split matters because the two systems have very different cost profiles and failure modes; lumping them into one number would hide which one is actually driving spend.
- Full activity funnel (visit → message → search → results found → contact unlock), tracked both in aggregate and per-user for real drop-off measurement
- Per-source ingestion health monitoring
- LLM cost split by system (assistant chat vs. ingestion), broken down by periods
- Live property inventory view — active/verified/unverified counts and new-listings trend
- Hour-by-hour activity view for today, layered across the whole funnel
The Outcome
Gave the team measurable product analytics for the first time — visibility into user drop-off, per-source ingestion health, and LLM cost by system — replacing guesswork with numbers the team could actually act on.
Gallery
some other pages from the analytics dashboard